The real-time data monitoring capability offers a real-time, multi-dimensional, and visualized display of the performance of TRTC applications, allowing you to monitor your applications in real time and detect and troubleshoot problems in a timely manner.
Note:
Data monitoring became a paid service on November 1, 2022. The default edition is free. You can purchase the paid edition to unlock more features.
Features
Real-time monitoring:
Statistics including the number of online rooms and users are collected and analyzed automatically at 10-second update intervals.
The real-time monitoring data is linked to the statistics on call details, making it easy for you to troubleshoot user-related issues.
Data is displayed in a visualized way from multiple dimensions. You can view statistics at a specific time point.
Directions
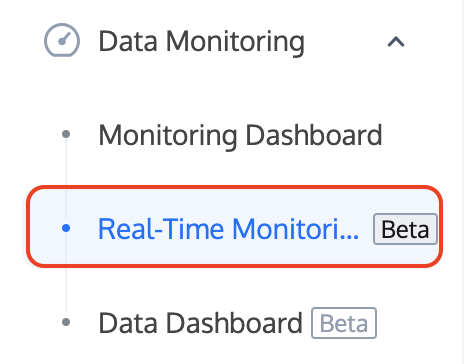
1. Log in to the TRTC console, select Data Monitoring > Real-Time Monitoring on the left sidebar. If you haven’t activated the data monitoring service yet, activate it first.
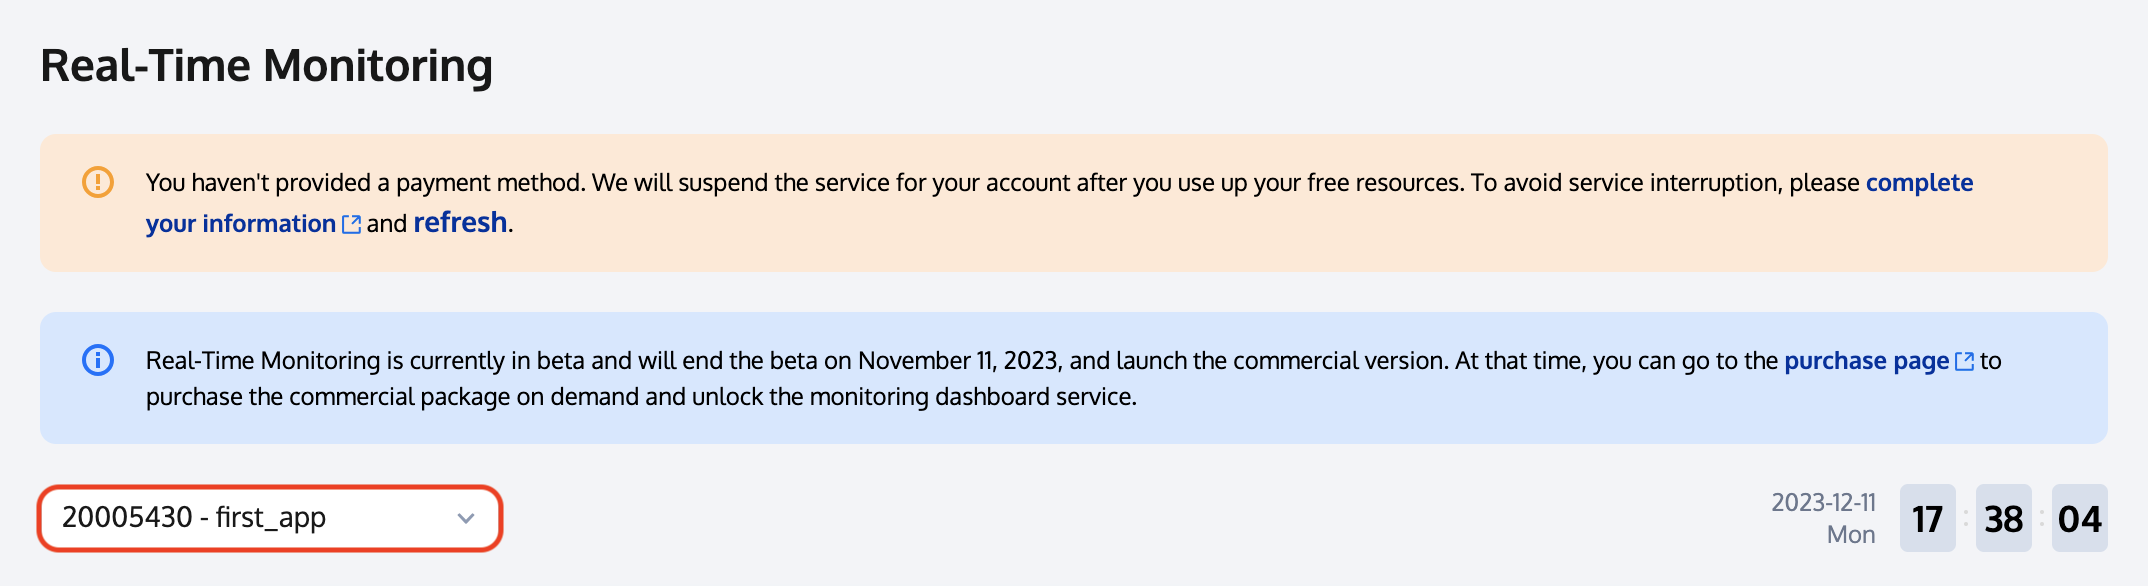
2. Select an application (SDKAppID) to monitor. Please note that you have to wait for about 10 minutes after an application is created before you can view its data.
Overview
The data on the real-time monitoring page is updated every 20 seconds (you can find the last updated time next to Latest data).
Select application: Select an application to view the data of all rooms under the application.
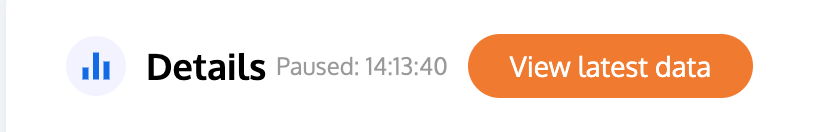
Pause data: Click Pause data to lock data at the current time, and click View latest data to unlock it.
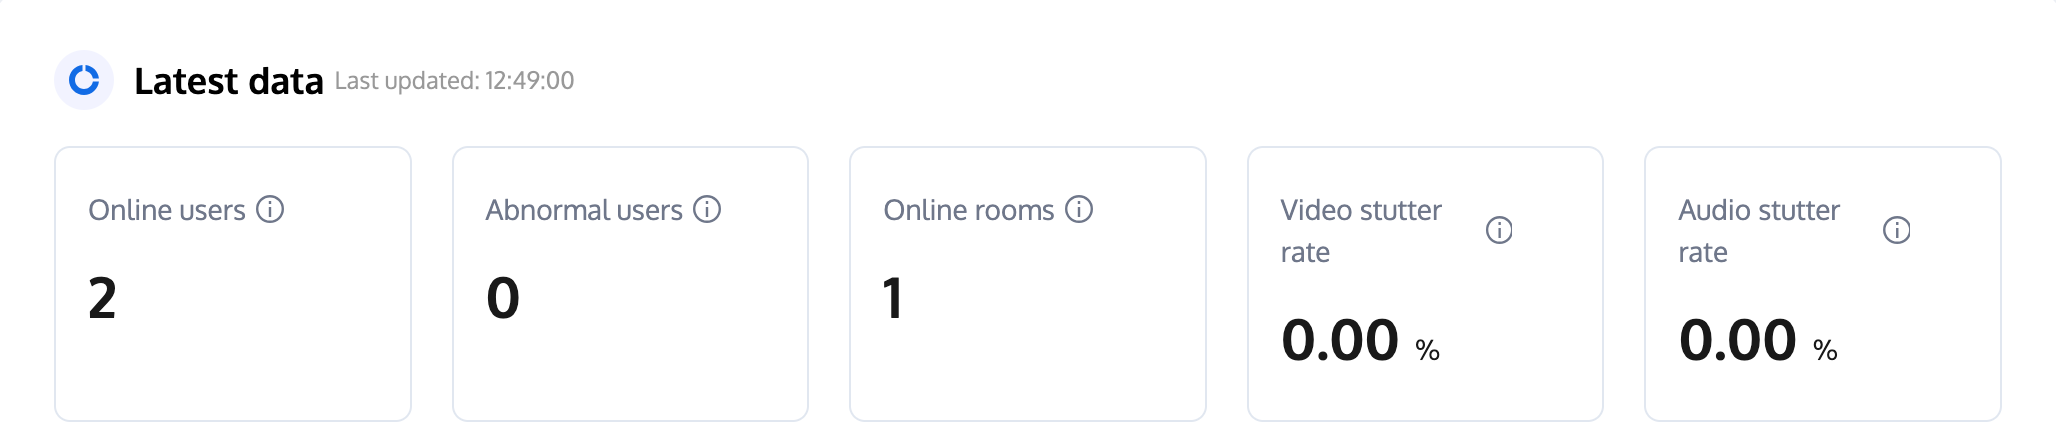
Latest data
The Latest data section shows online users, abnormal users, online rooms, video stutter rate, and audio stutter rate in the last 20 seconds. For details, see monitoring indicators. The data is updated every 20 seconds.
Details
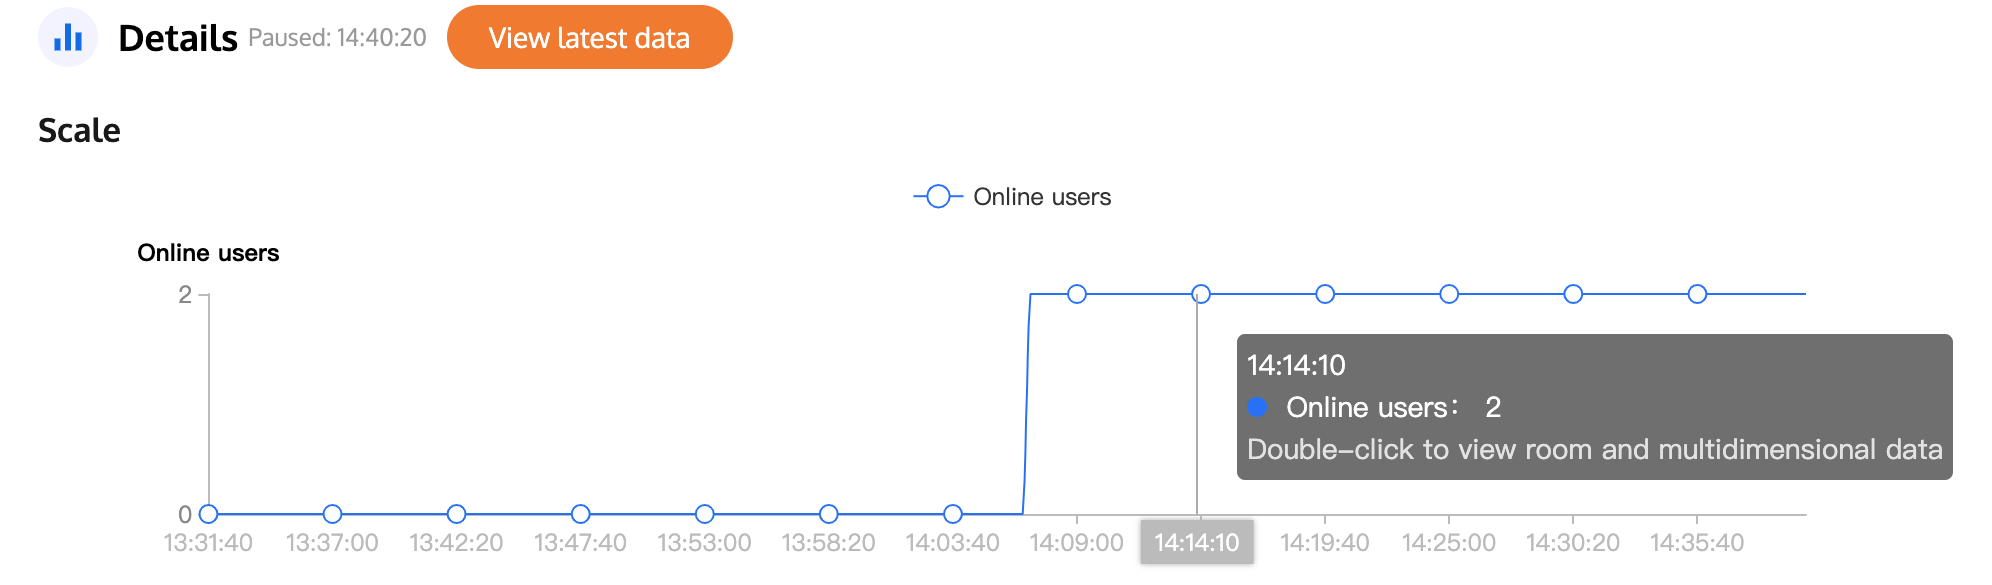
The Details section shows data for five different scale- and quality-related indicators. You can pause the data at the current time.
time state
Users can switch to the paused state or the latest state by clicking the button Pause data / View latest data, or switch to the paused state by double clicking the node in the image. In the locked state, the data will be fixed at a specific moment; in the latest state, it's updated every 20 seconds.
Scale indicators
This area uses line charts to show the number of online users (abnormal users) and rooms of the selected application in the last 64 minutes. The data is updated every 10 seconds. You can hover over anywhere on the line charts to view data at a specific time point and double-click a chart to pause data at the current time.
Quality indicators
This area uses line charts to show the average video and audio stutter rate and number of abnormal users in the last 64 minutes across all rooms of the selected application. The data is updated every 10 seconds. You can hover over anywhere on the line charts to view data at a specific time point and double-click a chart to pause data at the current time.
Example: The following image shows part of the page in a paused state.
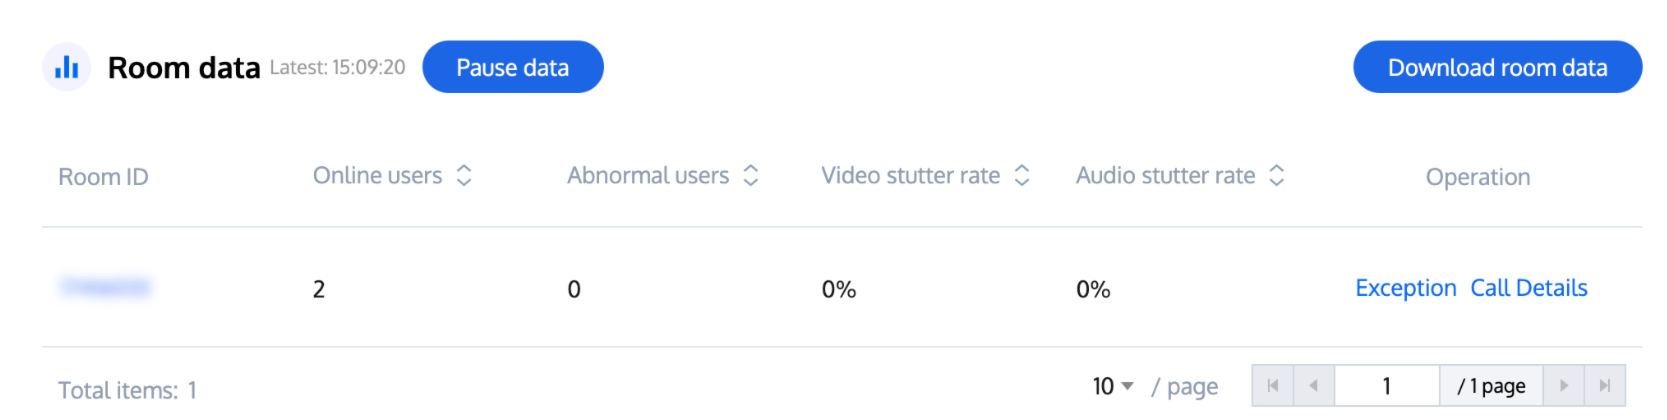
Room data
This area shows the Room ID, Online users, Abnormal users, Video stutter rate, Audio stutter rate, and Operation of active rooms.
Pause data: Support pause data to observe the room details at a specific time point, users can click the button Pause data to switch to the pause state, and click again to return to the latest state.
Download room data: Click Download room data to download the xlsx format file of room data at the current time.
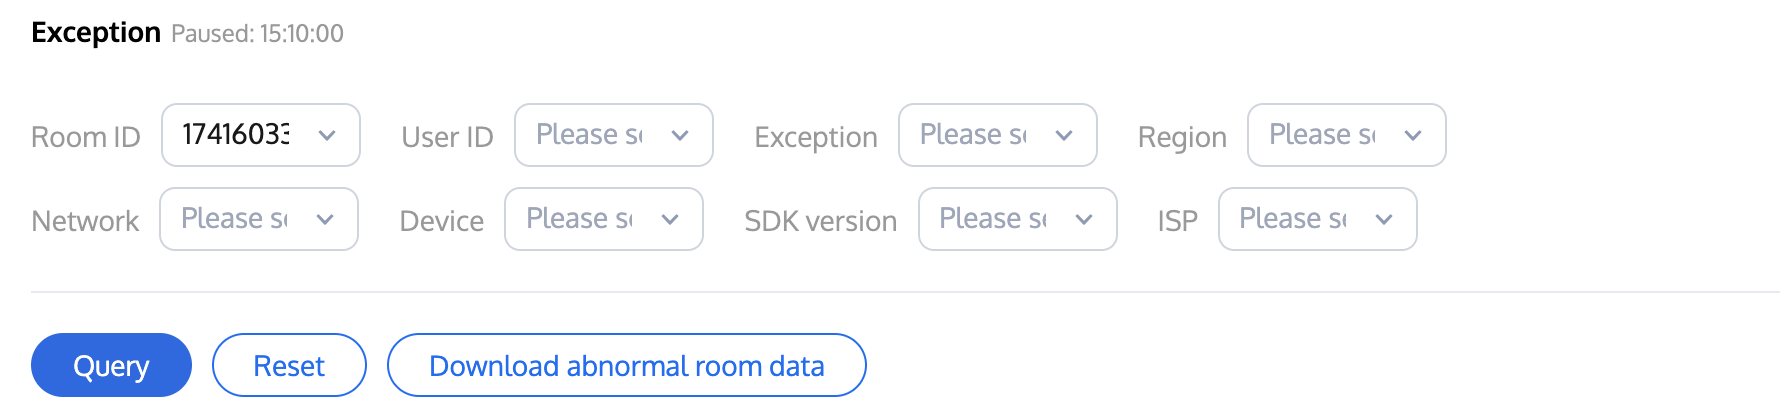
Abnormalroom data: Click Exception option under Operation field, user can view the abnormal room data, including 8 fields: Room ID, User ID, Exception, Region, Network, Device, SDK Version, ISP. user can filter the 8 dimensions to search for the abnormal data.
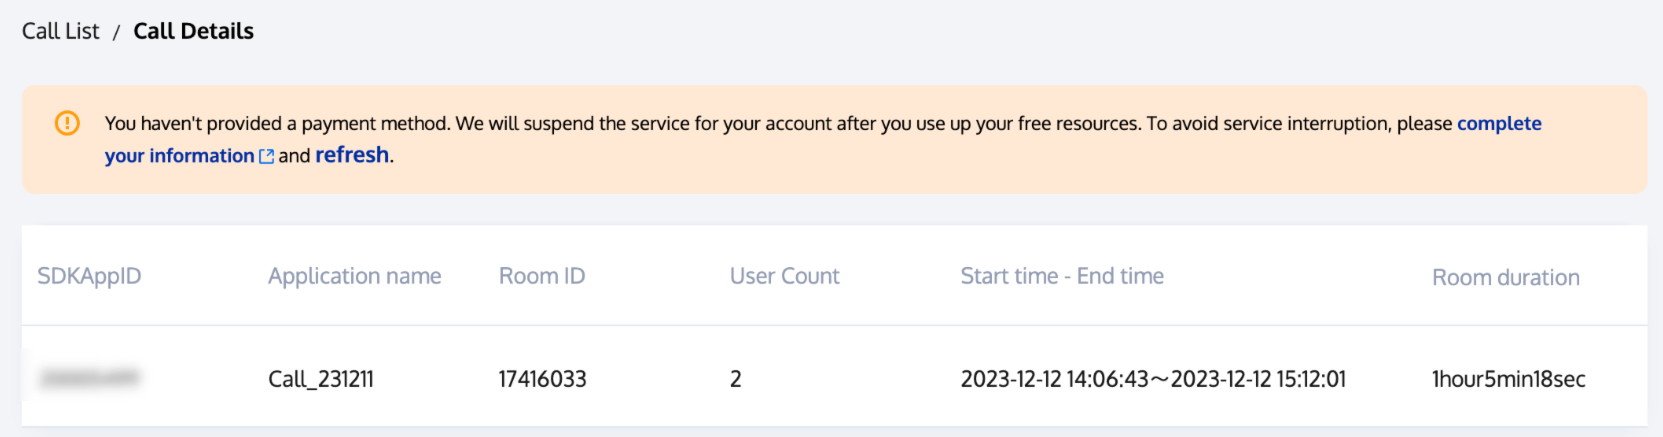
Call details: Click Call Details option under Operation field to view the call quality data of users in a room. See Call details for more description.
In the actions above, Download room data, Abnormal room data and Call details will pause data at the current time. To resume viewing the latest data, click View latest data next to Details.
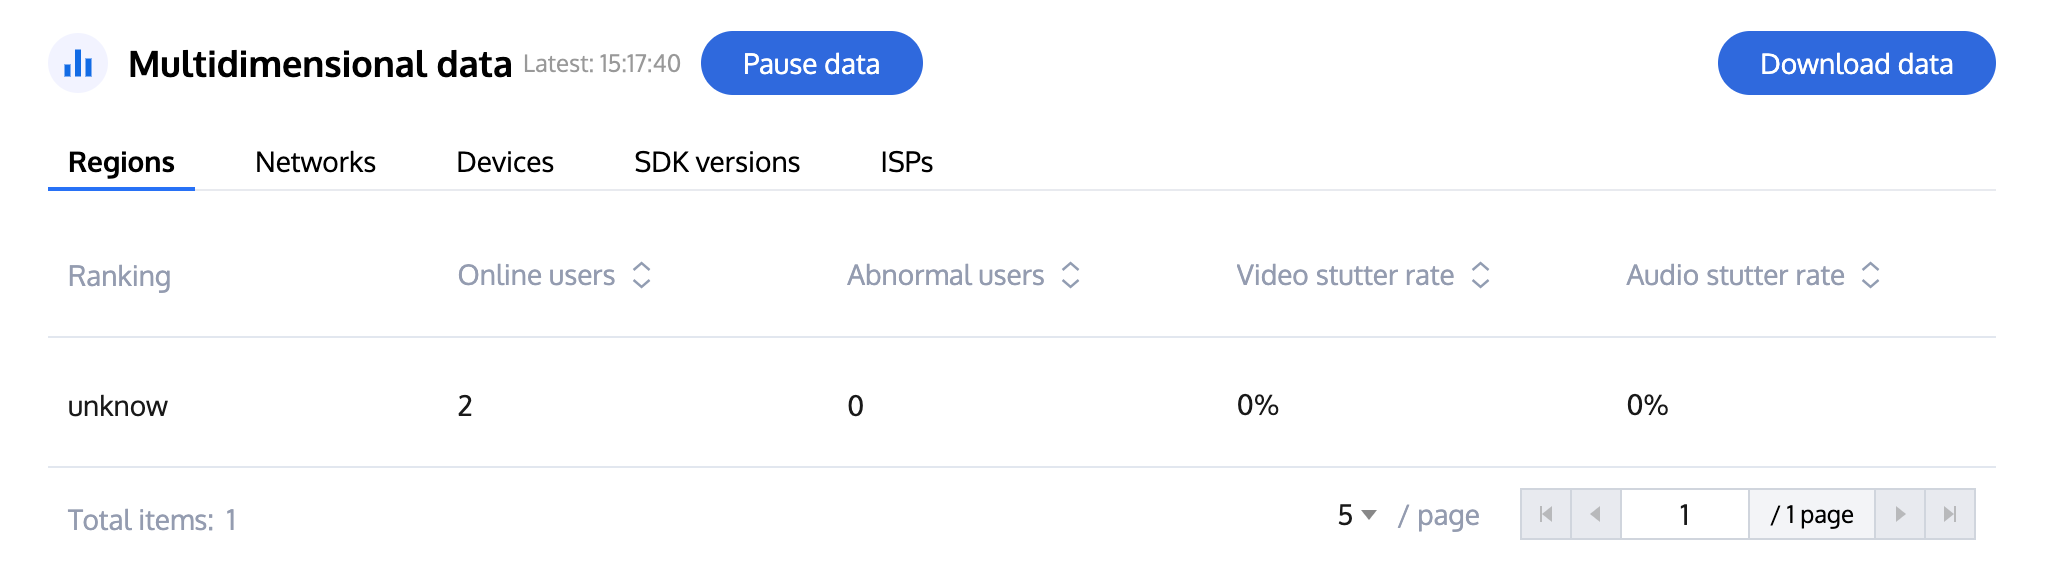
Multidimensional data
This area shows data from different dimensions such as region, network, device, SDK version, and ISP.
Support pause data to observe information at a specific point in time.
You can also download the data from this area.
Key Indicators
Scale indicators
Indicator
Description
Online users
The total number of users who entered the rooms of the selected application in the past 10 seconds. A user who entered multiple rooms is counted multiple times. A user who entered the same room multiple times is counted only once.
Online rooms
The total number of rooms that were entered by users in the past 10 seconds
Abnormal users
The total number of abnormal users (counted by user IDs) in the rooms of the selected application in the past 10 seconds. Abnormal users are users who encountered an exception.
Exceptions: no audio, abnormal video frame rate, high CPU usage.
Quality indicators
Indicator
Description
Video stutter rate
Stuttering duration (any stutter that lasts for 600 ms or longer)/Total video duration x 100%, updated every 10 seconds
Audio stutter rate
Stuttering duration (any stutter that lasts for 200 ms or longer is counted)/Total audio duration x 100%, updated every 10 seconds